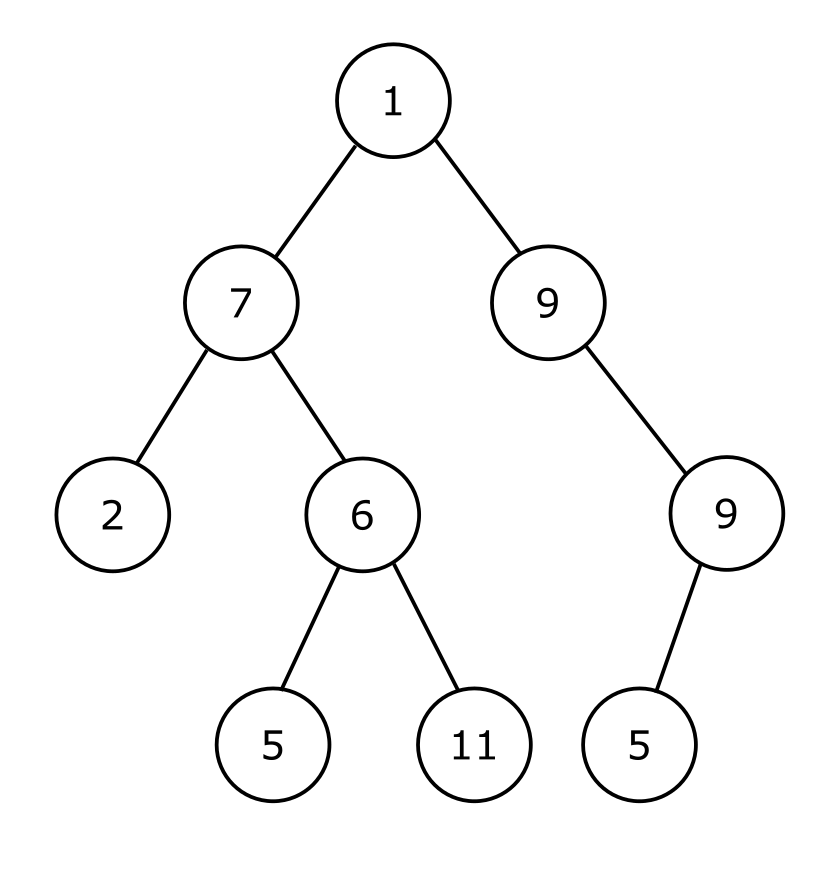
Figure 1. A Binary Tree. Image from Wikipedia.
An algorithm, according to Wikipedia, is a finite sequence of rigorous instructions. We can study algorithms from a theoretical or a practical perspective. This is a topic of computer science. Algorithms are significant because they control real-world systems.
A public transport system is one example of a complex system that can be optimised by algorithms and heuristics. (A heuristic is a less precise form of algorithm.) Many public organisations make data sets, statistics and charts publicly available. Charts provide immediate insight. For example, a chart of passenger kilometre trends from 2020 to 2022 shows how the Covid-19 pandemic impacted travel [1]. There was a marked increase in active travel (walking and cycling) due to government travel restrictions. The referenced graph shows a significant trend that was due to travel regulations. (Mathematical models provided some guidance on drafting those regulations.) Graphs like this may also be used to study algorithmic changes such as in the scheduling of trains and buses.
Graphical presentations of a data set provide a window into a system that is controlled by algorithms. When we make an adjustment to an algorithm, subsequent data will show the effect of that adjustment. This can be tested in computer simulation without affecting real systems and people’s day to day lives. Scheduling algorithms are applicable to transport and visualisation frameworks are available as commercial software packages.
We begin learning algorithms using familiar examples such as board games. We become proficient at a board game by developing a strategy. A mental strategy can be converted into a programmed algorithm, at least for simple problems. There are contrived problems with chess pieces that are simpler than the game of chess itself, for example the Knight’s Tour puzzle and the Eight Queens puzzle. Computer science students use these to study algorithms. How would we visualise these problems? Easily. The chess board is itself a visual and a physical aid. We can study them by moving actual chess pieces on the board.
If you have a strategy for playing some game of chance, draw it as a flowchart or use UML (Unified Modelling Language) to visualise your algorithm. The execution of an algorithm follows various paths and these can be represented as trees and other graphs. For example, a recursive algorithm for the Tower of Hanoi puzzle generates an execution path that is a binary tree (Figure 1, above). Tracing execution of the algorithm through the branches of this tree will help you to understand the algorithm.
A new algorithm should improve the optimisation of a process. You can simulate the effect of your algorithm by coding it as a computer program. Collect the output of your program as data and apply statistics to show whether or not your algorithm is better than an existing one. You can use the Excel or LibraOffice spreadsheet software to plot charts, such as bar graphs, that visualise the results. We are additionally concerned with the performance of an algorithm, that it makes efficient use of computer time and memory. The Bitcoin cryptocurrency uses proof of work which is an inefficient cryptographic algorithm. Bitcoin consumes as much energy as the country of Norway, ref: Cryptocurrency’s Energy Consumption Problem. There are a more energy efficient blockchain algorithms called proof of stake. Alternative algorithms can be compared by plotting their characteristics. A primary purpose of visualisation is to help us to make decisions, such as deciding on the best algorithm for a given application. However, we must be cautious of data that may be biased and of graphics that are overly persuasive. It is a popular quote that there are “Lies, damned lies, and statistics”.
Reference 1: UK Government National statistics, Transport Statistics Great Britain: 2022, Domestic Travel, Published 14 December 2023. Chart 1 is a line chart showing the trends over the past decade in distance travelled by non-ticketed and ticketed modes of transport, and active travel, indexed at 2012 levels.
This post began as a paragraph I wrote for a collaborative article on LinkedIn, What are the best ways to incorporate real-world examples into algorithm training?