Algorithms

Visualisation of Algorithms

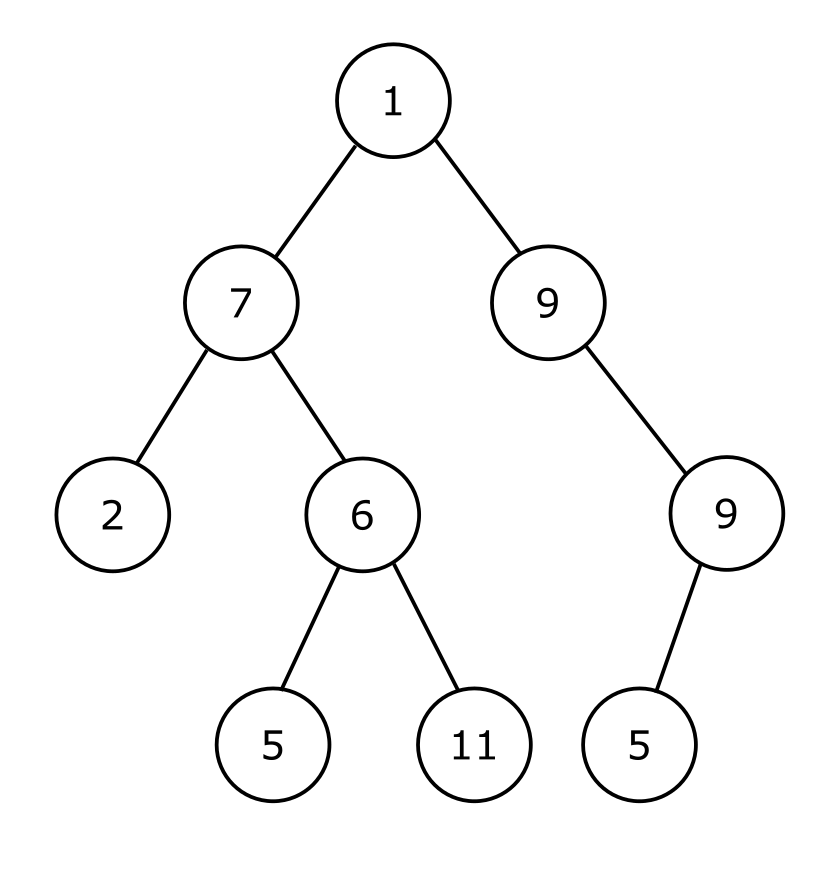
Figure 1. A Binary Tree. Image from Wikipedia.

An algorithm, according to Wikipedia, is a finite sequence of rigorous instructions. We can study algorithms from a theoretical or a practical perspective. This is a topic of computer science. Algorithms are significant because they control real-world systems.

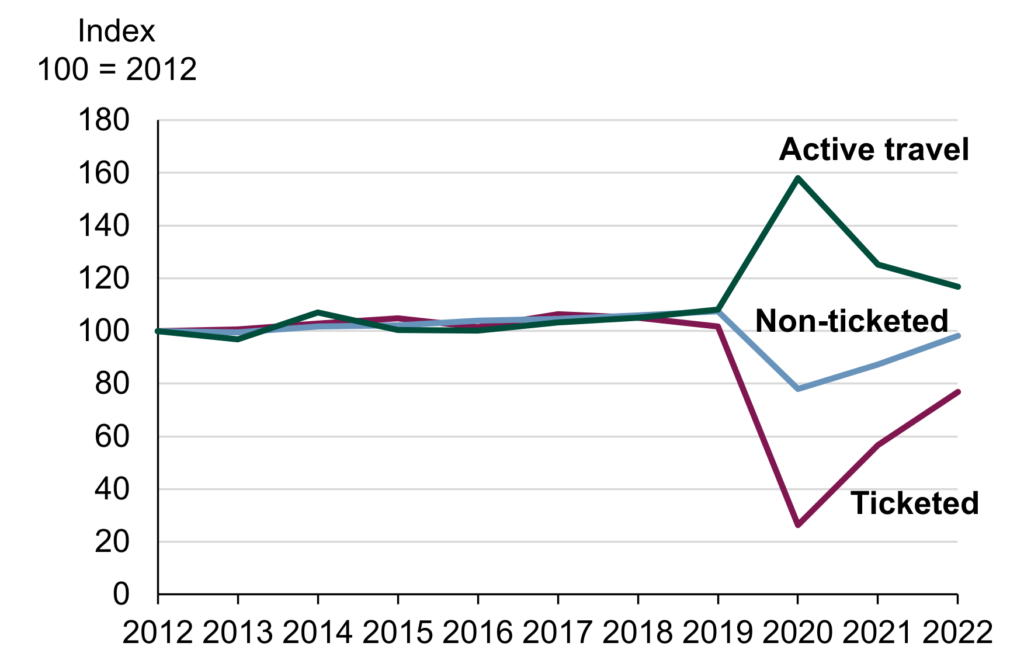
A public transport system is one example of a complex system that can be optimised by algorithms and heuristics. (A heuristic is a less precise form of algorithm.) Many public organisations make data sets, statistics and charts publicly available. Charts provide immediate insight. For example, a chart of passenger kilometre trends from 2020 to 2022 shows how the Covid-19 pandemic impacted travel [1]. There was a marked increase in active travel (walking and cycling) due to government travel restrictions. The referenced graph shows a significant trend that was due to travel regulations. (Mathematical models provided some guidance on drafting those regulations.) Graphs like this may also be used to study algorithmic changes such as in the scheduling of trains and buses.

Graphical presentations of a data set provide a window into a system that is controlled by algorithms. When we make an adjustment to an algorithm, subsequent data will show the effect of that adjustment. This can be tested in computer simulation without affecting real systems and people’s day to day lives. Scheduling algorithms are applicable to transport and visualisation frameworks are available as commercial software packages.

We begin learning algorithms using familiar examples such as board games. We become proficient at a board game by developing a strategy. A mental strategy can be converted into a programmed algorithm, at least for simple problems. There are contrived problems with chess pieces that are simpler than the game of chess itself, for example the Knight’s Tour puzzle and the Eight Queens puzzle. Computer science students use these to study algorithms. How would we visualise these problems? Easily. The chess board is itself a visual and a physical aid. We can study them by moving actual chess pieces on the board.

If you have a strategy for playing some game of chance, draw it as a flowchart or use UML (Unified Modelling Language) to visualise your algorithm. The execution of an algorithm follows various paths and these can be represented as trees and other graphs. For example, a recursive algorithm for the Tower of Hanoi puzzle generates an execution path that is a binary tree (Figure 1, above). Tracing execution of the algorithm through the branches of this tree will help you to understand the algorithm.

A new algorithm should improve the optimisation of a process. You can simulate the effect of your algorithm by coding it as a computer program. Collect the output of your program as data and apply statistics to show whether or not your algorithm is better than an existing one. You can use the Excel or LibraOffice spreadsheet software to plot charts, such as bar graphs, that visualise the results. We are additionally concerned with the performance of an algorithm, that it makes efficient use of computer time and memory. The Bitcoin cryptocurrency uses proof of work which is an inefficient cryptographic algorithm. Bitcoin consumes as much energy as the country of Norway, ref: Cryptocurrency’s Energy Consumption Problem. There are a more energy efficient blockchain algorithms called proof of stake. Alternative algorithms can be compared by plotting their characteristics. A primary purpose of visualisation is to help us to make decisions, such as deciding on the best algorithm for a given application. However, we must be cautious of data that may be biased and of graphics that are overly persuasive. It is a popular quote that there are “Lies, damned lies, and statistics”.

Reference 1: UK Government National statistics, Transport Statistics Great Britain: 2022, Domestic Travel, Published 14 December 2023. Chart 1 is a line chart showing the trends over the past decade in distance travelled by non-ticketed and ticketed modes of transport, and active travel, indexed at 2012 levels.

This post began as a paragraph I wrote for a collaborative article on LinkedIn, What are the best ways to incorporate real-world examples into algorithm training?

Learning to Code Algorithms

How can you improve your skill in developing software algorithms? You should begin with a simple problem then progress to more difficult ones. Use more than one programming language. Visualise your algorithms to aid learning. Share your ideas with others or enter online coding competitions.

The Fibonacci sequence is a popular example. This is series of numbers in which the next number is generated by adding the two previous numbers. 0, 1, 1, 2, 3, 5, 8, ... This sounds simple enough, but there is more than one way of writing a computer program to do this. The simplest method is to use a program loop. In each iteration of the loop perform an addition and store the answer in a variable for use in the next two iterations of the loop.

When you have accomplished this, try to create a recursive algorithm. A recursive algorithm contains a subroutine that calls itself. You can find plenty of program examples on question and answer websites like Stackoverflow.

One criterion for an algorithm is: When do you terminate the program? There is a simple answer to this for a program loop. If you wish to calculate one hundred Fibonacci numbers, increment a counter each time around the loop and terminate the loop when the counter reaches the desired value. (If you are coding in assembly language, it is better to decrement a counter and terminate when it is zero by use of a conditional jump instruction.) Program termination is a trickier for recursive algorithms. Unintuitively, for the Fibonacci sequence, the last subroutine call calculates with the smallest numbers, 0+1=1. Thus, the program must end the recursion when the values to be added are zero and one. When a subroutine is called recursively, the program must return through all the function calls in reverse order. It is this repeated return operation that generates the sequence of increasing Fibonacci numbers.

What problem should you try next. I suggest the Tower of Hanoi puzzle. The recursive algorithm for this is more complicated than for the Fibonacci sequence. Why is that? If you compare example solutions you will see that the subroutine for the Fibonacci algorithm calls itself once, whereas the subroutine for the Tower of Hanoi calls itself twice. If your goal is to practice coding rather than to solve problems, find an existing solution on the web, glance at it briefly, then code the algorithm in your chosen programming language.

There are countless types of problems that can be optimised using algorithms. A public transport system can be made more efficient by applying scheduling algorithms. Real-world data is often publicly available for public transport systems. Your investigation of algorithms can be applied as well as theoretical. The travelling salesman problem is another popular example on computer science courses. It involves combinatorics and graph theory and can be solved by different methods including a nearest neighbour approach and genetic algorithms.

How else can you improve your skills? If you know two programming languages, code the same algorithm in both languages. Code in assembly language if you wish to understand how a microprocessor works, in Python because it is interpreted, or in Haskell or OCaml because they are functional languages. A good IDE (Integrated Development Environment) makes software development more productive. Consider using Microsoft Visual Studio 2022 or alternative IDEs like Eclipse, PyCharm or KDevelop (on Linux). Take advantage of the debugger within the IDE to help you understand how your program works. Set a breakpoint at a critical step or single step through execution of the program. Watch numeric variables to see that they have the values expected.

Use pseudocode to describe your ideas for a new algorithm. Pseudocode is an informal coding style suitable for sharing your ideas with people rather than with computers. It can be useful in the technical part of a job interview. Visualisation is a powerful approach to learning. You could draw a flowchart for a program or sketch out its execution path. The execution path for the Tower of Hanoi algorithm will look like a tree (a binary tree), because the subroutine calls itself twice, each call generating a new branch of the tree.

If you wish to begin coding computer algorithms it sufficient that you enjoy puzzles and know some basic algebra. If you enjoy mathematics, do progress to more advanced topics including number theory, combinatorics, and graph theory.

Consider the complexity of algorithms, which can be represented using Big O notation.

You can find a list of coding competitions here: Top 15 Websites for Coding Challenges and Competitions. Note that Google have closed all their coding competitions due to staff layoffs.

This post began as a paragraph I wrote for a collaborative article on LinkedIn, How can you win an algorithmic competition?